
Ticket reports and team performance
SLA compliance, average first response, resolution time, customer satisfaction and each team member's performance — in figures.
Overview#
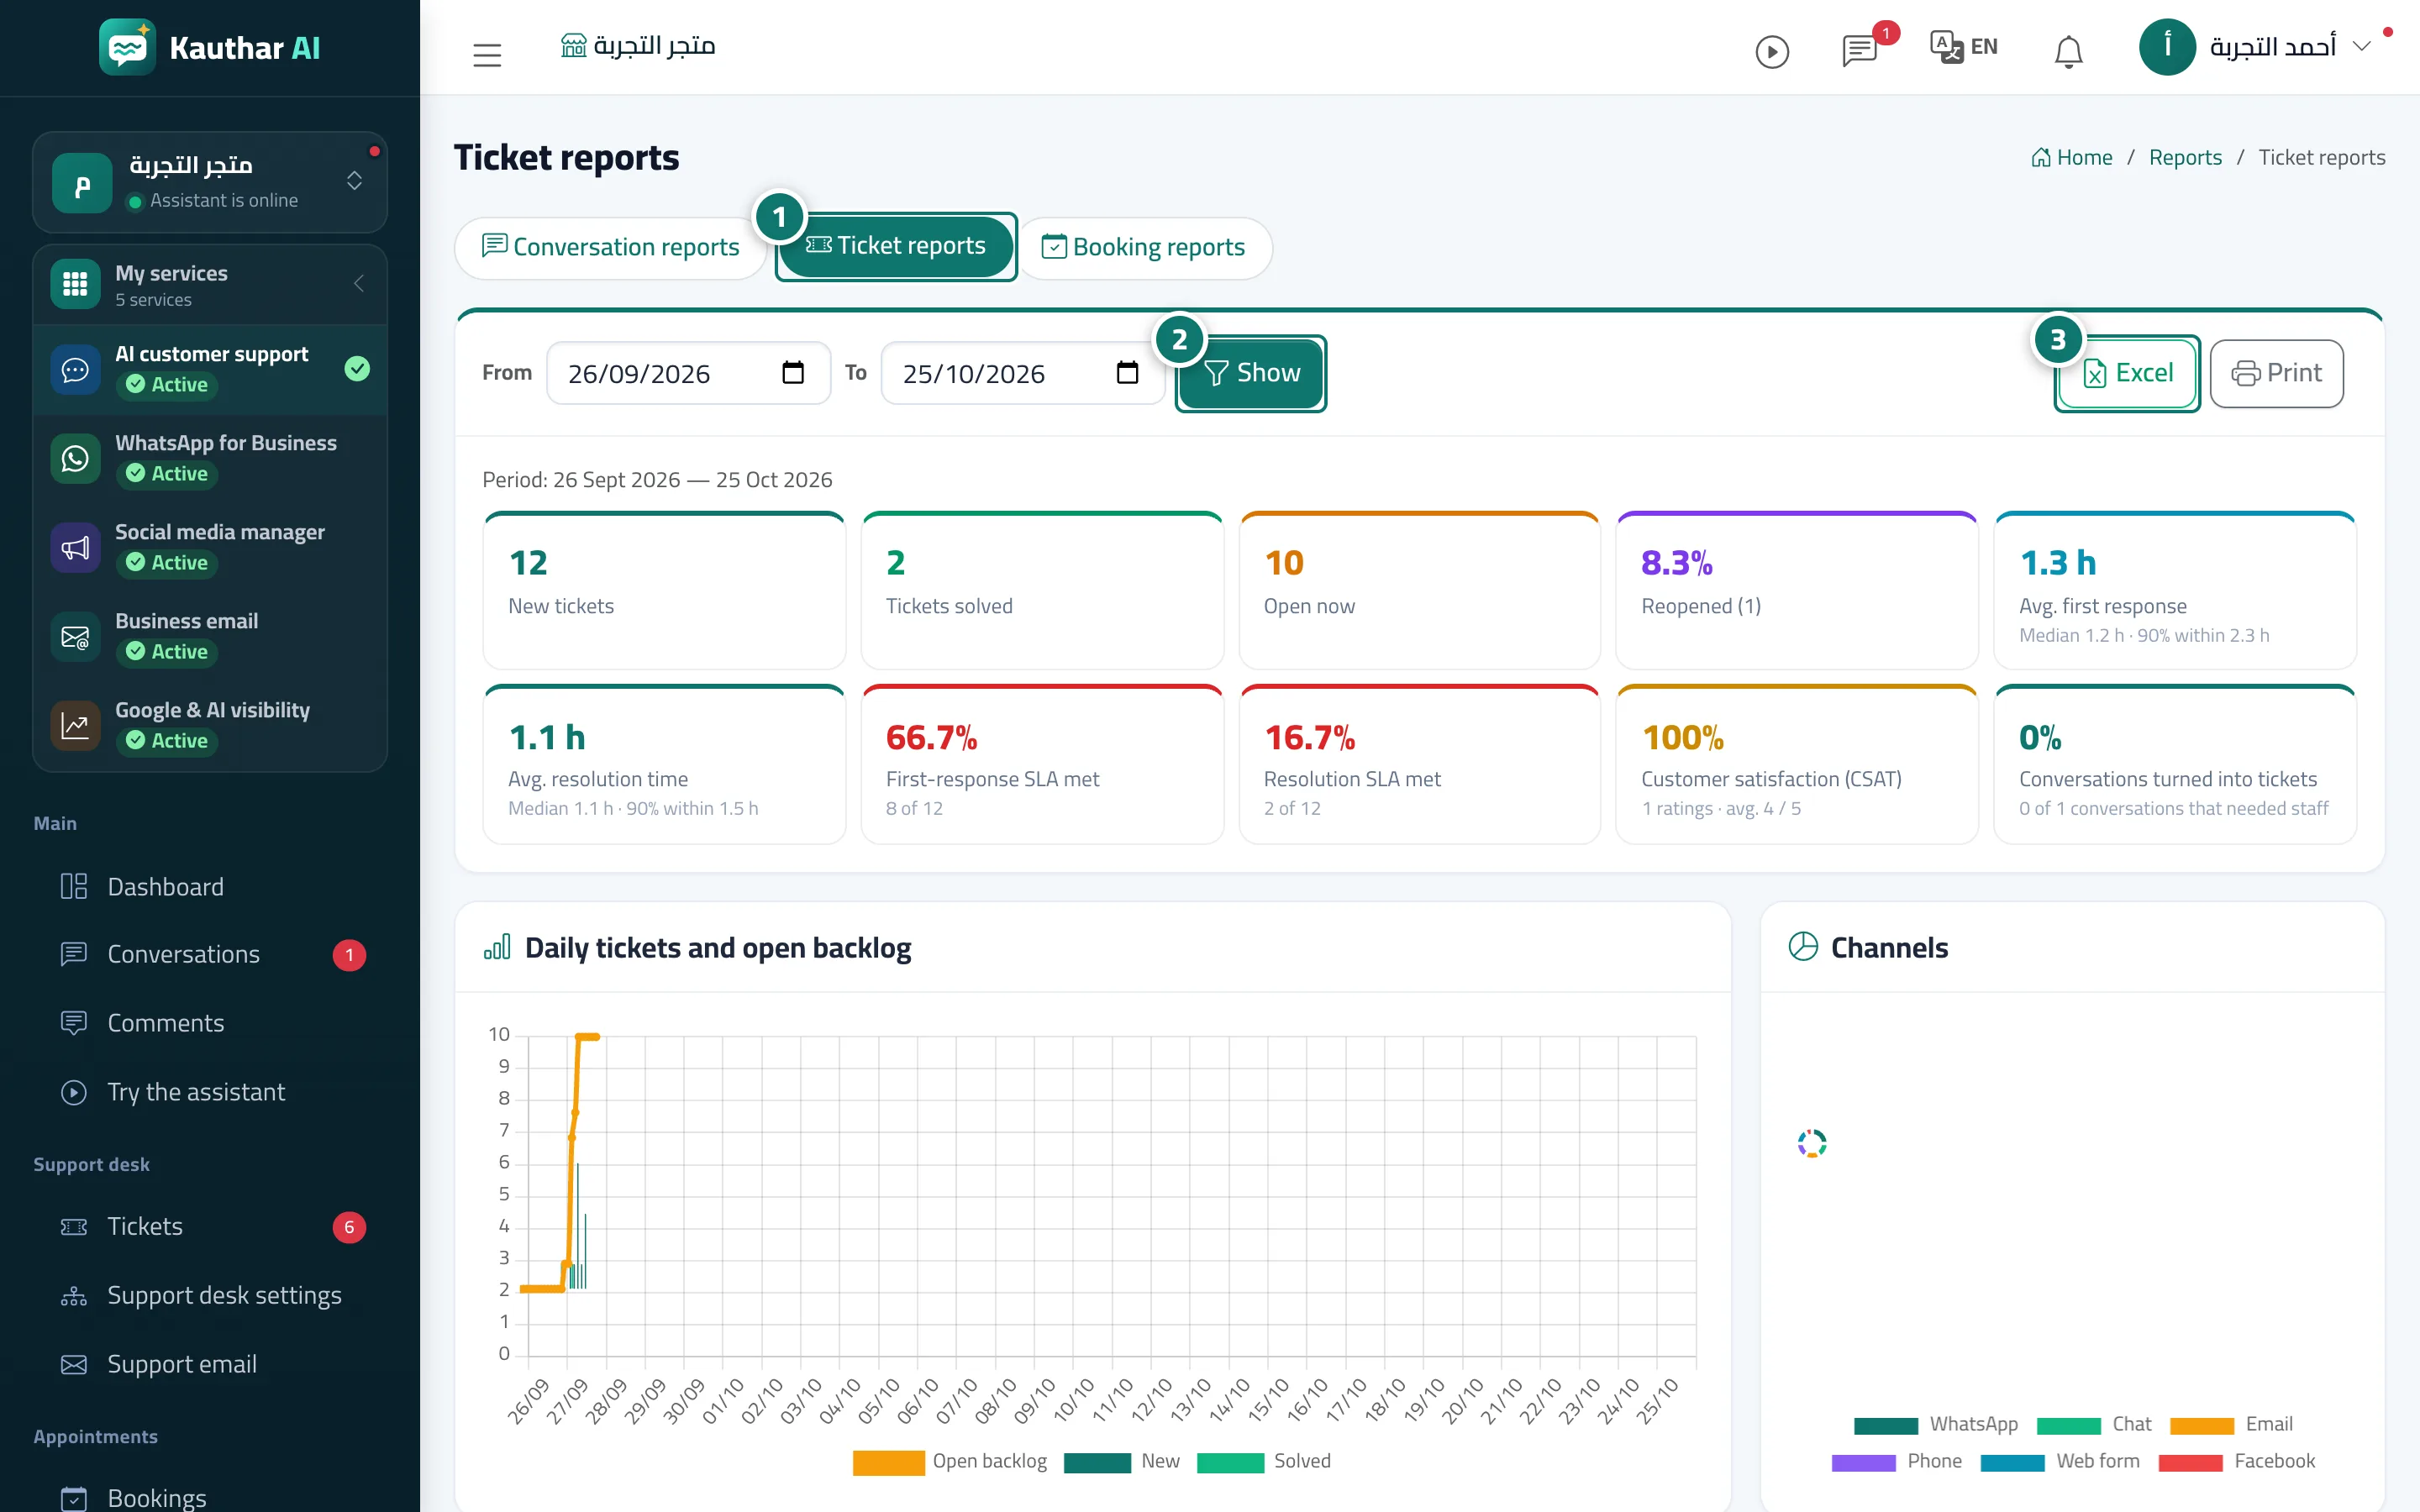
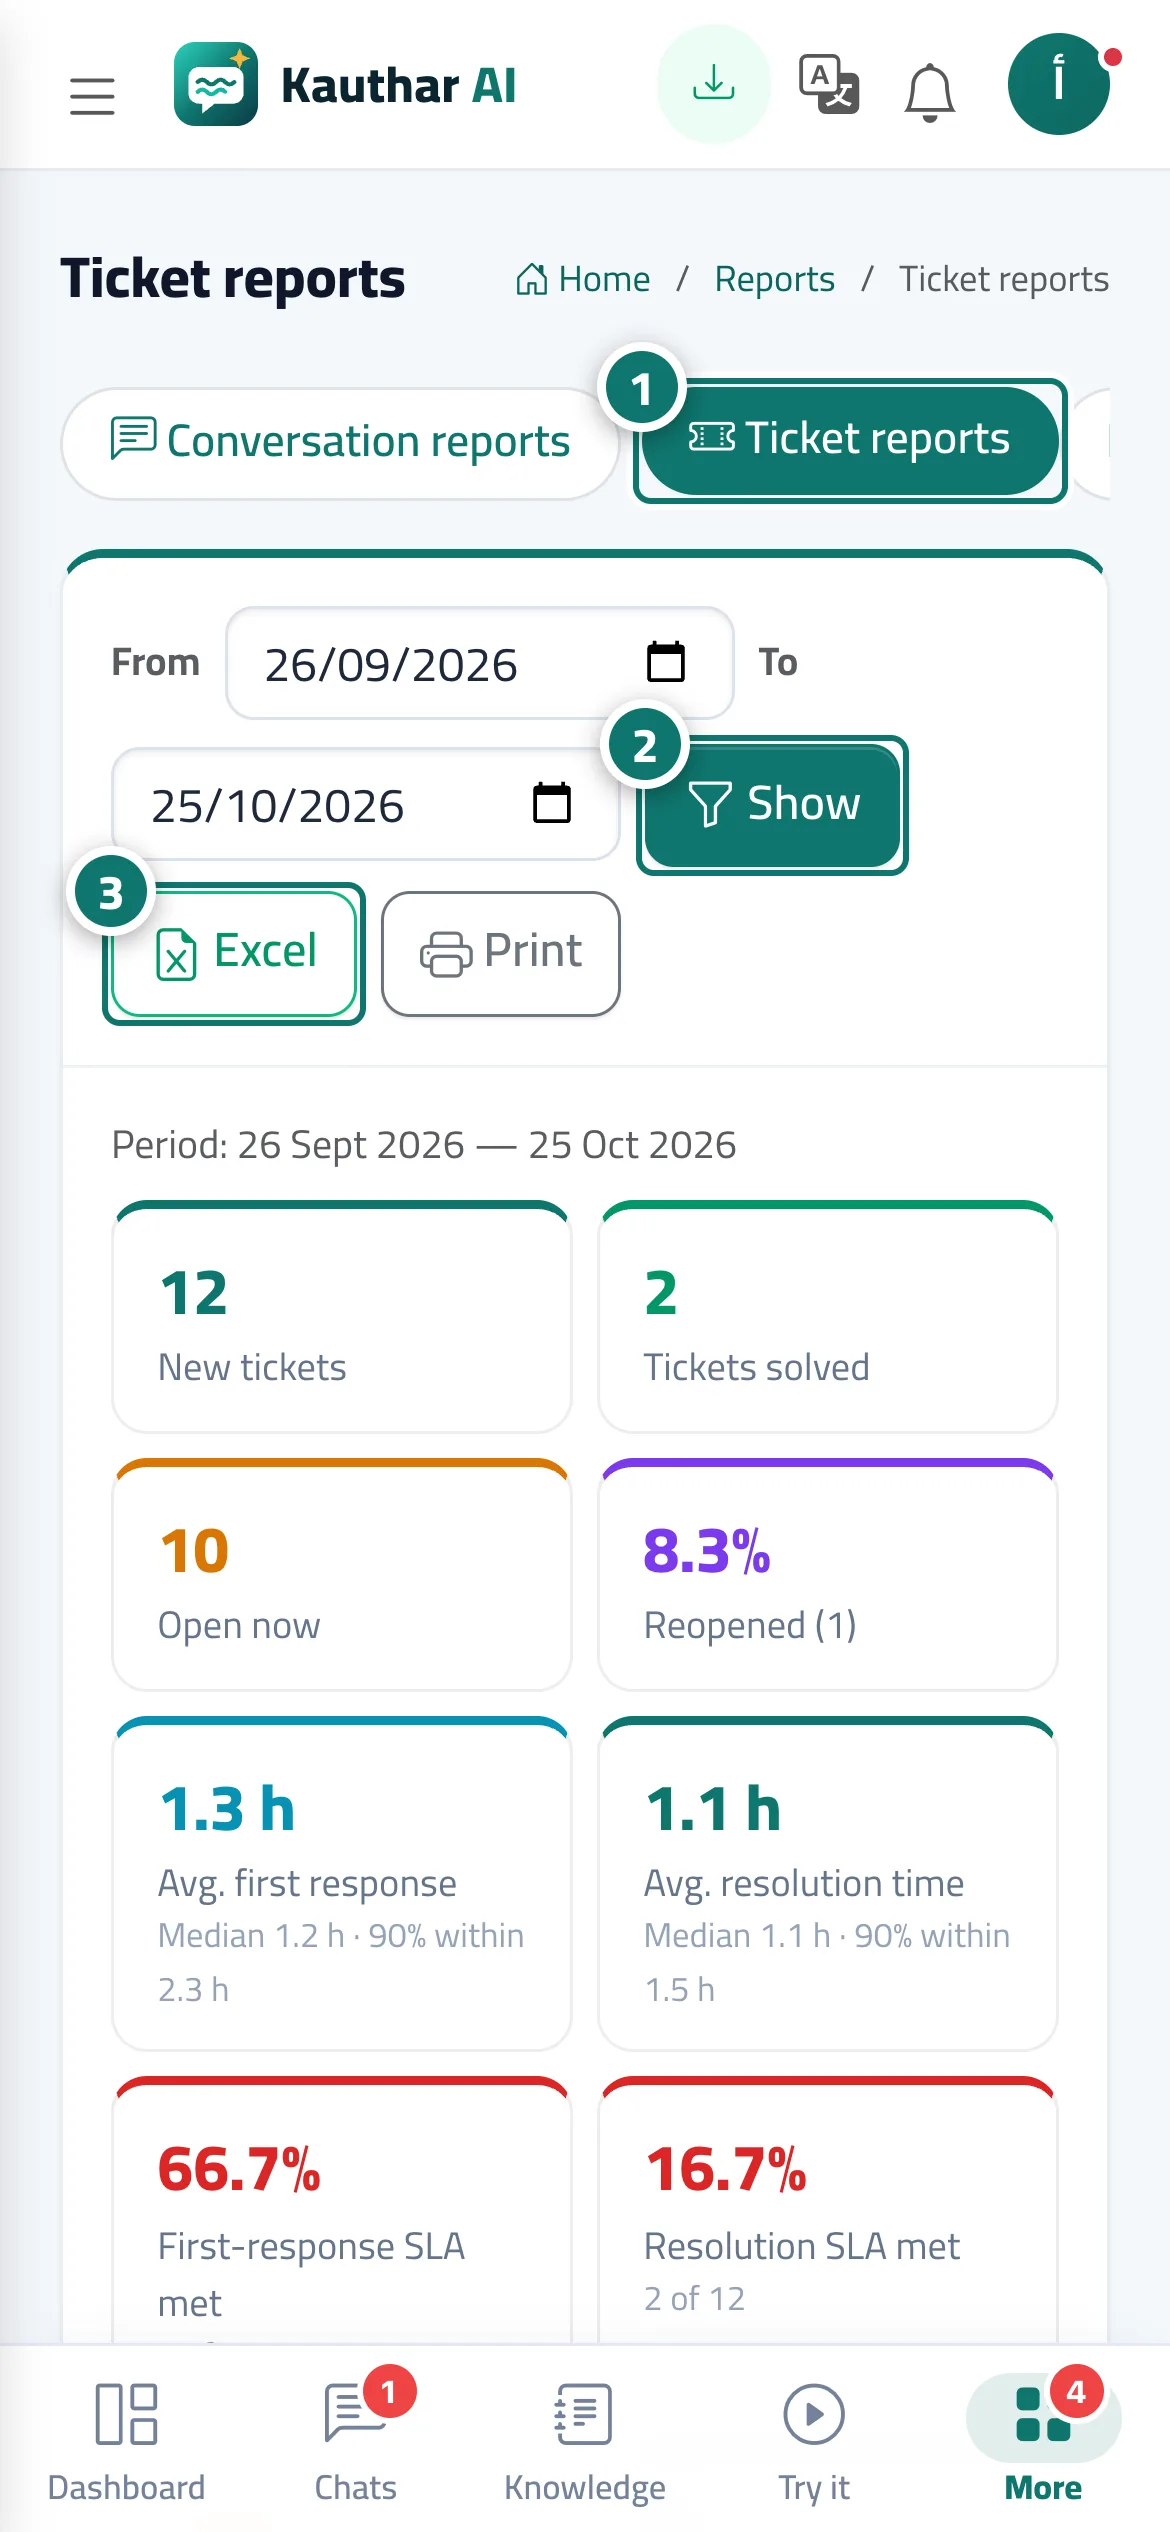
The Ticket reports tab shows: New tickets, Tickets solved, Open now, Reopened, Avg. first response and Avg. resolution time (with the median and the time for 90% of tickets), First-response SLA met and Resolution SLA met, Customer satisfaction (CSAT) and Conversations turned into tickets. With charts and tables: Daily tickets and open backlog, the breakdown By channel, By type, By department and By priority, Customer ratings breakdown, Customer sentiment, Agent performance, Top categories, Top tags and Latest customer comments. This tab requires a plan that includes advanced reports (Pro or Business).
- Who can use it
- Business owner / manager
- Where to find it
- Sidebar → Channels & customers → Reports → Ticket reports tab
Step by step#
- Open Reports, then the Ticket reports tab.
- Choose From and To and click View.
- Export the report with Excel or Print.
Tips#
Good to know#
Frequently asked questions#
What does 90% within mean?
That 90% of tickets were answered (or solved) within this time or less — a more accurate measure than the average when there are exceptional tickets.
How is customer satisfaction calculated?
From the ratings (1 to 5) that customers send after their ticket is solved.
Why is there a lock on the tab?
Because your current plan doesn't include advanced reports. The business owner can upgrade from the subscription page.